
A Practical Baseline for OpenTelemetry on Kubernetes
By Nicolas Narbais
How to split node-local and cluster-wide OpenTelemetry Collectors on Kubernetes with Helm, explicit OTLP export to a backend, and a small proof path for traces, metrics, and logs.
Introduction
The first Kubernetes OpenTelemetry setup usually fails for a boring reason: the Collector is deployed in the wrong shape.
A Kubernetes OTel stack that works starts with ownership: which Collector sees node-local data, which Collector sees cluster-wide data, and which exporter sends it to a backend.
It is tempting to look for one YAML file that collects everything: application traces, application logs, node metrics, pod metrics, cluster metrics, Kubernetes events, and backend export. The official getting-started flow uses a cleaner split: a DaemonSet for node-local and workload-local telemetry, and a Deployment for cluster-wide metrics and events (OpenTelemetry Kubernetes Getting Started).
This article defines a minimal topology baseline. It proves Kubernetes telemetry can be collected, enriched, routed, and exported without collapsing node-local and cluster-wide responsibilities.
The hard parts are deployment shape, metadata, and data routing, even when SDKs are configured correctly. If you get those wrong, a perfectly instrumented service still produces telemetry that is hard to correlate, hard to route, or never exported to a real backend.
This baseline is intentionally small:
- one service that emits real OTLP telemetry
- one DaemonSet Collector path
- one Deployment Collector path
- one OTLP-capable backend
- one trace, one metric, and one log to prove the path works
What Each Collector Is Responsible For
Start with the ownership model.
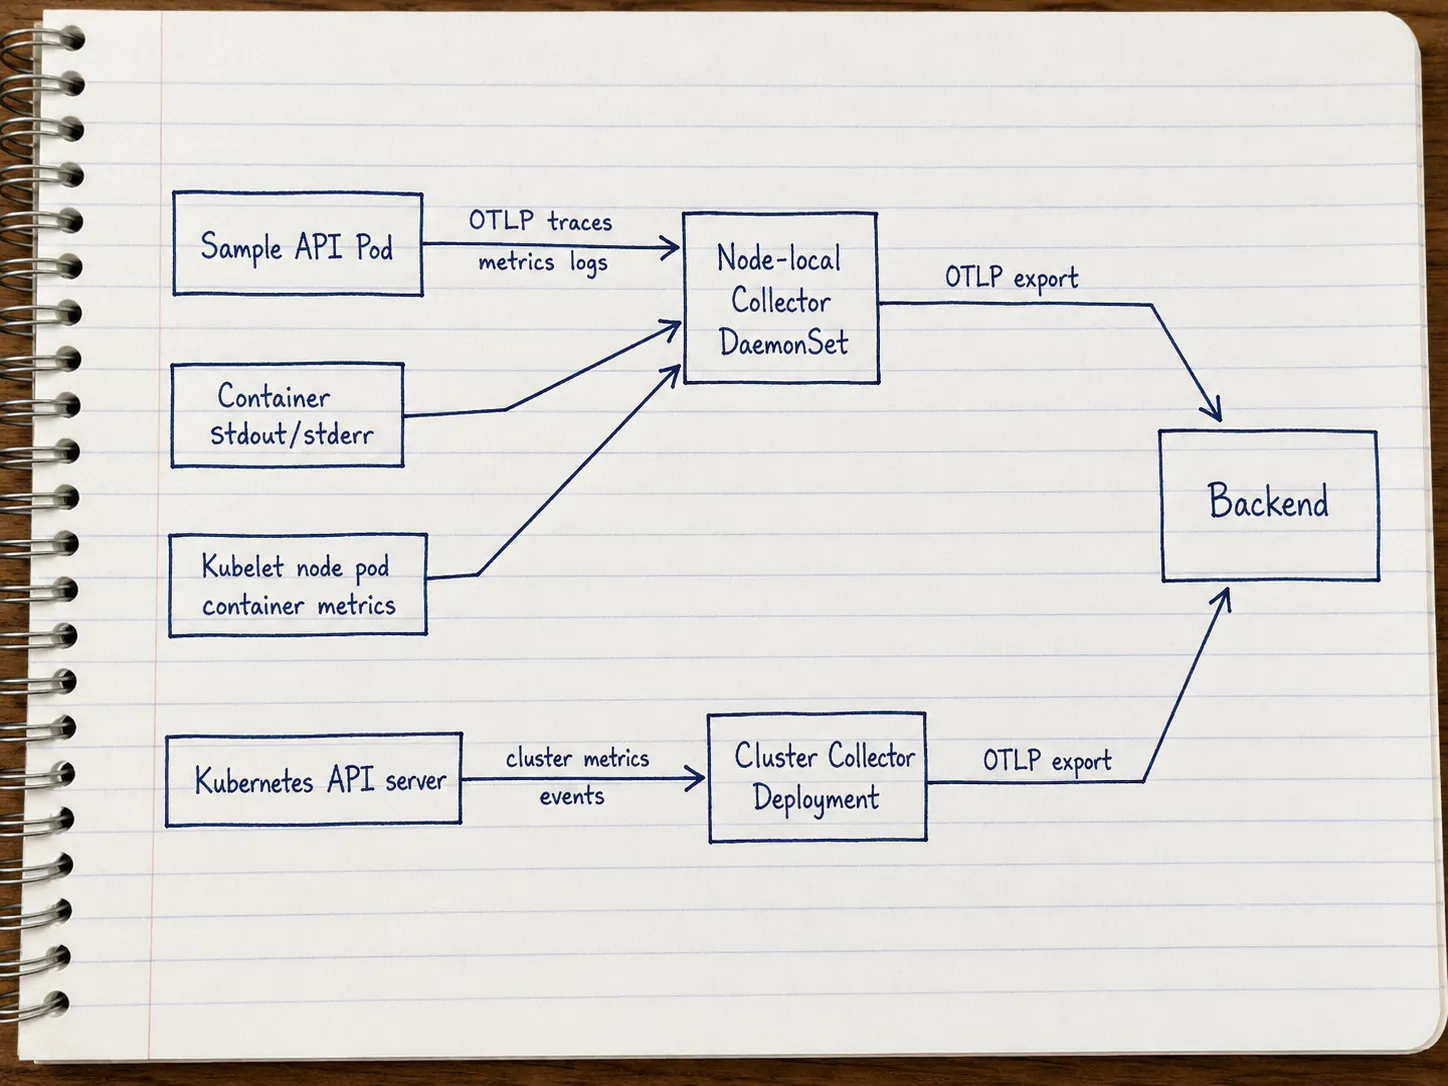
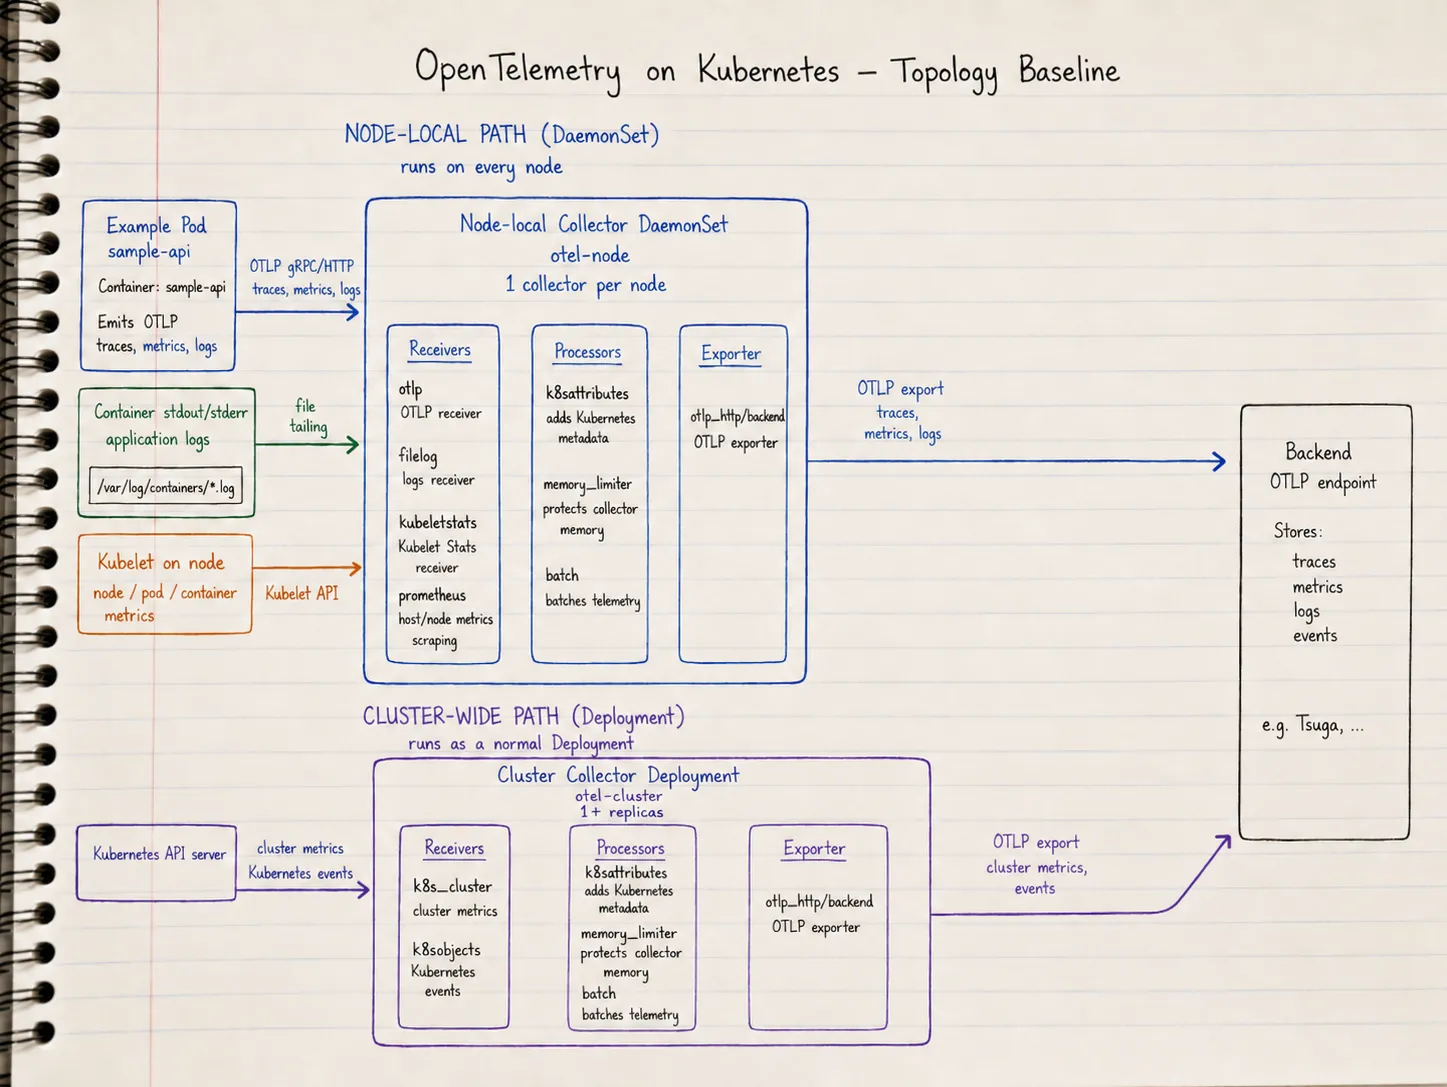
The DaemonSet Collector is the node-local agent path. It runs one Collector per node, which makes it a good fit for telemetry that is naturally tied to workloads on that node: service OTLP, container logs, and kubelet-derived node, pod, and container metrics. When you use a DaemonSet Collector as an agent, the recommended pattern is to send application telemetry to the Collector on the same node, not to a shared endpoint that load-balances across nodes. That avoids shipping OTLP to a random peer node and keeps Kubernetes metadata correlation simpler: the agent that enriches telemetry sits beside the workload it serves. The official guide describes this DaemonSet as the place for the OTLP receiver, Kubernetes attributes processor, kubeletstats receiver, and filelog receiver (OpenTelemetry Kubernetes Getting Started, Agent deployment pattern).
The Deployment Collector is the cluster-wide path. It runs as a normal Deployment and collects data that should not be duplicated per node: cluster metrics and Kubernetes events.
The Collector chart docs make the same split visible in the presets: kubelet and host metrics are recommended with mode=daemonset, while cluster metrics and Kubernetes events are recommended with mode=deployment or a single-replica StatefulSet (OpenTelemetry Collector Chart).
Install the Node-Local Collector Path
Install the chart once in DaemonSet mode. This is the path your sample service will use to send OTLP telemetry, and it is also where node-local logs and kubelet metrics belong.
First add the chart repository:
helm repo add open-telemetry https://open-telemetry.github.io/opentelemetry-helm-charts
helm repo update
kubectl create namespace observability --dry-run=client -o yaml | kubectl apply -f -
Check the available chart versions before you choose the version for your baseline. In production, pin the chart version and test rendered config changes before upgrading.
helm search repo open-telemetry/opentelemetry-collector --versions | head
export OTEL_COLLECTOR_CHART_VERSION="replace-with-chart-version"
The receiver and processor lists below are representative. Render your chart version first and copy the exact generated component IDs. Do not assume these names survive chart upgrades.
Use a values-node.yaml like this:
fullnameOverride: otel-node
mode: daemonset

image:
  repository: otel/opentelemetry-collector-k8s

extraEnvs:
  - name: BACKEND_TOKEN
    valueFrom:
      secretKeyRef:
        name: otel-backend
        key: token

service:
  enabled: true

ports:
  otlp:
    enabled: true
    containerPort: 4317
    servicePort: 4317
    hostPort: 4317
  otlp-http:
    enabled: true
    containerPort: 4318
    servicePort: 4318
    hostPort: 4318
  jaeger-compact:
    enabled: false
  jaeger-thrift:
    enabled: false
  jaeger-grpc:
    enabled: false
  zipkin:
    enabled: false

presets:
  kubernetesAttributes:
    enabled: true
  kubeletMetrics:
    enabled: true
  logsCollection:
    enabled: true

config:
  exporters:
    otlp_http/backend:
      endpoint: https://intake.<cluster_name>.tsuga.com:443/api/v1/otlp
      # endpoint: https://otel-backend.example.com
      headers:
        authorization: "Bearer ${env:BACKEND_TOKEN}"

  service:
    pipelines:
      traces:
        receivers: [otlp]
        processors: [k8sattributes, memory_limiter, batch]
        exporters: [otlp_http/backend]
      metrics:
        receivers: [otlp, prometheus, kubeletstats]
        processors: [k8sattributes, memory_limiter, batch]
        exporters: [otlp_http/backend]
      logs:
        receivers: [otlp, filelog]
        processors: [k8sattributes, memory_limiter, batch]
        exporters: [otlp_http/backend]
This representative chart values only shows the pieces this baseline changes. Pipeline overlays are easy to get wrong: when you change a pipeline, explicitly list the receivers, processors, and exporters that should remain active. This example keeps the beginner traces path OTLP-only.
Why this pattern: a DaemonSet runs one Collector per node, so sending to the node-local Collector avoids load-balancing telemetry to random nodes and keeps Kubernetes metadata correlation simpler.
Is this the recommended approach? Yes. For a DaemonSet Collector used as an agent, the recommended pattern is to send telemetry to the Collector on the same node (Agent deployment pattern).
On Kubernetes, expose OTLP on the node with hostPort on the DaemonSet (4317 for gRPC, 4318 for HTTP in values-node.yaml above). Client pods then target the node IP, not localhost and not a cluster-wide Service that can load-balance to another node.
For a pod in the same cluster, this is a good default:
env:
  - name: NODE_IP
    valueFrom:
      fieldRef:
        fieldPath: status.hostIP
  - name: OTEL_EXPORTER_OTLP_PROTOCOL
    value: http/protobuf
  - name: OTEL_EXPORTER_OTLP_ENDPOINT
    value: "http://$(NODE_IP):4318"
For gRPC instead of HTTP/protobuf:
env:
  - name: NODE_IP
    valueFrom:
      fieldRef:
        fieldPath: status.hostIP
  - name: OTEL_EXPORTER_OTLP_ENDPOINT
    value: "http://$(NODE_IP):4317"
status.hostIP is the IP of the node where the client pod runs. With hostPort on the Collector DaemonSet, that address reaches the Collector on the same node. localhost inside another pod is still not the Collector.
service.enabled: true keeps a ClusterIP Service for convenience (for example port-forward from a laptop). In-cluster workloads should prefer NODE_IP for same-node delivery.
Create the backend token Secret before installing:
kubectl create secret generic otel-backend \
  --namespace observability \
  --from-literal=token="$BACKEND_TOKEN" \
  --dry-run=client -o yaml | kubectl apply -f -
Then install it:
helm install otel-node open-telemetry/opentelemetry-collector \
  --namespace observability \
  --version "$OTEL_COLLECTOR_CHART_VERSION" \
  --values values-node.yaml
The important part is explicit export. The backend name can change. The Kubernetes getting-started docs mention it directly. The chart sends data to the debug exporter by default, so you have to configure an exporter if you want to use the telemetry in a proper platform (OpenTelemetry Kubernetes Getting Started). The chart docs show the default exporter as debug, which is fine for a smoke test. A real backend needs its own exporter (OpenTelemetry Collector Chart).
Some vendors document an OTLP HTTP base endpoint. Others document signal-specific paths or require custom headers. Use your backend’s OTLP HTTP configuration instead of the placeholder URL.
For authentication, do not paste a real token into values.yaml. The snippet reads BACKEND_TOKEN from a Kubernetes Secret through extraEnvs. Replace that with your normal secret-management path if you use External Secrets, Vault, sealed secrets, or another mechanism.
Use the debug exporter to prove that the Collector received telemetry. Send durable telemetry to a backend. Be especially careful when collecting container logs: exporting collected logs back to Collector stdout can create confusing feedback loops unless exclusions are configured deliberately.
Install the Cluster-Wide Collector Path
Now install the chart a second time in Deployment mode. Run this Collector once when it collects cluster-wide state. Duplicate cluster receivers create duplicate data.
The receiver and processor lists below are representative. Render your chart version first and copy the exact generated component IDs. Do not assume these names survive chart upgrades.
Use values-cluster.yaml:
fullnameOverride: otel-cluster
mode: deployment
replicaCount: 1

image:
  repository: otel/opentelemetry-collector-k8s

extraEnvs:
  - name: BACKEND_TOKEN
    valueFrom:
      secretKeyRef:
        name: otel-backend
        key: token

presets:
  clusterMetrics:
    enabled: true
  kubernetesEvents:
    enabled: true

config:
  exporters:
    otlp_http/backend:
      endpoint: https://otel-backend.example.com
      headers:
        authorization: "Bearer ${env:BACKEND_TOKEN}"

  service:
    pipelines:
      # The otlp receiver can be included only if you intentionally want to preserve the chart’s default receiver. For a stricter cluster-only path, remove it and keep only k8s_cluster and k8sobjects.
      metrics:
        # receivers: [oltp, prometheus, k8s_cluster]
        receivers: [k8s_cluster]
        processors: [memory_limiter, batch]
        exporters: [otlp_http/backend]
      logs:
        # receivers: [otlp, k8sobjects]
        receivers: [k8sobjects]
        processors: [memory_limiter, batch]
        exporters: [otlp_http/backend]
Install it as a separate release:
helm install otel-cluster open-telemetry/opentelemetry-collector \
  --namespace observability \
  --version "$OTEL_COLLECTOR_CHART_VERSION" \
  --values values-cluster.yaml
This second install prevents a common beginner mistake: forcing all Kubernetes monitoring through one Deployment Collector. A Deployment can receive application OTLP if services can reach it. Node-local log files and kubelet-local metrics fit a DaemonSet better. A DaemonSet can see node-local data. Cluster-wide receivers belong in a single Deployment or single-replica StatefulSet.
Side note: A gateway pattern solves a separate problem. A gateway Collector is a central point that receives telemetry from clients or other Collectors and then processes, load-balances, or exports it onward (Gateway deployment pattern). You may add one later, especially when you need centralized routing, tail sampling, or backend isolation. The beginner baseline only needs to separate node-local collection from cluster-wide collection and export both paths somewhere real.
Render Before You Install
Do not rely on values-file intent. Render the chart and inspect the final Kubernetes objects and Collector config before applying them:
helm template otel-node open-telemetry/opentelemetry-collector \
  --namespace observability \
  --version "$OTEL_COLLECTOR_CHART_VERSION" \
  --values values-node.yaml > rendered-node.yaml

helm template otel-cluster open-telemetry/opentelemetry-collector \
  --namespace observability \
  --version "$OTEL_COLLECTOR_CHART_VERSION" \
  --values values-cluster.yaml > rendered-cluster.yaml
Check the generated manifests for the things that usually break first: receiver names, processor names, exporter names, pipeline membership, service names, OTLP ports, environment variables, and RBAC.
These quick checks make the review less abstract:
grep -n "otelcol" -A120 rendered-node.yaml
grep -n "receivers:" -A50 rendered-node.yaml
grep -n "exporters:" -A30 rendered-node.yaml
grep -n "hostPort" -B2 -A2 rendered-node.yaml
For the node path, you should see the otlp receiver in the application pipelines, filelog in the logs pipeline, kubeletstats in the metrics pipeline, k8sattributes in active pipelines, and otlp_http/backend in every durable pipeline. For the cluster path, you should see k8s_cluster in metrics and k8sobjects in logs. You should not see an accidental debug exporter in the durable logs path.
A DaemonSet gives you one Collector pod per node. Confirm the rendered DaemonSet publishes OTLP on the host and that clients use status.hostIP:
kubectl -n observability get pods -l app.kubernetes.io/instance=otel-node -o wideYou can also inspect the mounted Collector config from the running workloads. The config path can vary by chart version, so replace /conf/relay.yaml by the path shown in the rendered manifest:
kubectl exec -n observability daemonset/otel-node -- cat /conf/relay.yaml
kubectl exec -n observability deploy/otel-cluster -- cat /conf/relay.yaml
This baseline uses hostPort plus NODE_IP in client manifests so each pod targets its node without hard-coding addresses. A Service with internalTrafficPolicy: Local is another valid same-node pattern if you prefer Service DNS over node IP.
Send Test Telemetry, Then Test a Real Service
Start with telemetrygen so you can prove the Collector and backend path before debugging an application.
Quick smoke test from your laptop
Port-forward the node Collector service and send one trace, one metric, and one log through the same OTLP receiver:
# Example pin. Check the latest compatible collector-contrib release before publishing.
go install github.com/open-telemetry/opentelemetry-collector-contrib/cmd/telemetrygen@v0.151.0

kubectl -n observability port-forward svc/otel-node 4317:4317

telemetrygen traces --otlp-insecure --otlp-endpoint localhost:4317 --traces 1
telemetrygen metrics --otlp-insecure --otlp-endpoint localhost:4317 --metrics 1
telemetrygen logs --otlp-insecure --otlp-endpoint localhost:4317 --logs 1
That proves the receiver, pipeline, exporter, and backend path. It leaves Kubernetes workload metadata untested, because telemetry generated from your laptop is not emitted by a pod.
Generate telemetry inside the cluster
Run telemetrygen as a pod in the cluster. Set NODE_IP from status.hostIP and pass --otlp-endpoint "${NODE_IP}:4317" so traffic goes to the Collector on the same node. telemetrygen uses flags rather than OTEL_EXPORTER_OTLP_ENDPOINT, so the manifests below wrap the command in /bin/sh -c to expand NODE_IP.
For a one-shot proof, use Jobs. Each pod exits after it sends data, which is easy to inspect with kubectl logs job/...:
# telemetrygen-smoke.yaml
apiVersion: batch/v1
kind: Job
metadata:
  name: telemetrygen-traces
  namespace: observability
spec:
  backoffLimit: 2
  template:
    metadata:
      labels:
        app: telemetrygen
        signal: traces
    spec:
      restartPolicy: Never
      containers:
        - name: telemetrygen
          image: ghcr.io/open-telemetry/opentelemetry-collector-contrib/telemetrygen:0.151.0
          env:
            - name: NODE_IP
              valueFrom:
                fieldRef:
                  fieldPath: status.hostIP
          command: ["/bin/sh", "-c"]
          args:
            - >-
              exec /telemetrygen traces
              --otlp-insecure
              --otlp-endpoint "${NODE_IP}:4317"
              --traces=5
---
apiVersion: batch/v1
kind: Job
metadata:
  name: telemetrygen-metrics
  namespace: observability
spec:
  backoffLimit: 2
  template:
    metadata:
      labels:
        app: telemetrygen
        signal: metrics
    spec:
      restartPolicy: Never
      containers:
        - name: telemetrygen
          image: ghcr.io/open-telemetry/opentelemetry-collector-contrib/telemetrygen:0.151.0
          env:
            - name: NODE_IP
              valueFrom:
                fieldRef:
                  fieldPath: status.hostIP
          command: ["/bin/sh", "-c"]
          args:
            - >-
              exec /telemetrygen metrics
              --otlp-insecure
              --otlp-endpoint "${NODE_IP}:4317"
              --metrics=10
---
apiVersion: batch/v1
kind: Job
metadata:
  name: telemetrygen-logs
  namespace: observability
spec:
  backoffLimit: 2
  template:
    metadata:
      labels:
        app: telemetrygen
        signal: logs
    spec:
      restartPolicy: Never
      containers:
        - name: telemetrygen
          image: ghcr.io/open-telemetry/opentelemetry-collector-contrib/telemetrygen:0.151.0
          env:
            - name: NODE_IP
              valueFrom:
                fieldRef:
                  fieldPath: status.hostIP
          command: ["/bin/sh", "-c"]
          args:
            - >-
              exec /telemetrygen logs
              --otlp-insecure
              --otlp-endpoint "${NODE_IP}:4317"
              --logs=5
kubectl apply -f telemetrygen-smoke.yaml
kubectl -n observability wait --for=condition=complete job/telemetrygen-traces job/telemetrygen-metrics job/telemetrygen-logs --timeout=120s
kubectl -n observability logs job/telemetrygen-traces
# NODE_IP on the generator pod should match the host IP of the local Collector pod
kubectl -n observability get pod -l signal=traces -o jsonpath='{.items[0].status.hostIP}{"\n"}'
kubectl -n observability get pods -l app.kubernetes.io/instance=otel-node -o wideWhen k8sattributes is active, backend telemetry from these Jobs should carry pod and namespace metadata. That is the check port-forwarding from a laptop cannot give you.
Sustained load
To keep telemetrygen running at a fixed rate across several metric types, the same layout maps cleanly to one Deployment per generator. Reuse the NODE_IP plus hostPort pattern so each replica sends to the Collector on its node.
Adjust --duration, --rate, and resource limits for your cluster:
# telemetrygen-load.yaml
apiVersion: apps/v1
kind: Deployment
metadata:
  name: telemetrygen-traces
  namespace: observability
spec:
  replicas: 1
  selector:
    matchLabels:
      app: telemetrygen-traces
  template:
    metadata:
      labels:
        app: telemetrygen-traces
    spec:
      containers:
        - name: telemetrygen
          image: ghcr.io/open-telemetry/opentelemetry-collector-contrib/telemetrygen:0.151.0
          env:
            - name: NODE_IP
              valueFrom:
                fieldRef:
                  fieldPath: status.hostIP
          command: ["/bin/sh", "-c"]
          args:
            - >-
              exec /telemetrygen traces
              --otlp-insecure
              --otlp-endpoint "${NODE_IP}:4317"
              --duration=1h
              --rate=5
              --traces=5
---
apiVersion: apps/v1
kind: Deployment
metadata:
  name: telemetrygen-metrics-gauge
  namespace: observability
spec:
  replicas: 1
  selector:
    matchLabels:
      app: telemetrygen-metrics-gauge
  template:
    metadata:
      labels:
        app: telemetrygen-metrics-gauge
    spec:
      containers:
        - name: telemetrygen
          image: ghcr.io/open-telemetry/opentelemetry-collector-contrib/telemetrygen:0.151.0
          env:
            - name: NODE_IP
              valueFrom:
                fieldRef:
                  fieldPath: status.hostIP
          command: ["/bin/sh", "-c"]
          args:
            - >-
              exec /telemetrygen metrics
              --otlp-insecure
              --otlp-endpoint "${NODE_IP}:4317"
              --metric-type=Gauge
              --otlp-metric-name=telemetrygen.gauge
              --duration=1h
              --rate=5
              --metrics=10
---
apiVersion: apps/v1
kind: Deployment
metadata:
  name: telemetrygen-metrics-counter
  namespace: observability
spec:
  replicas: 1
  selector:
    matchLabels:
      app: telemetrygen-metrics-counter
  template:
    metadata:
      labels:
        app: telemetrygen-metrics-counter
    spec:
      containers:
        - name: telemetrygen
          image: ghcr.io/open-telemetry/opentelemetry-collector-contrib/telemetrygen:0.151.0
          env:
            - name: NODE_IP
              valueFrom:
                fieldRef:
                  fieldPath: status.hostIP
          command: ["/bin/sh", "-c"]
          args:
            - >-
              exec /telemetrygen metrics
              --otlp-insecure
              --otlp-endpoint "${NODE_IP}:4317"
              --metric-type=Sum
              --aggregation-temporality=cumulative
              --otlp-metric-name=telemetrygen.counter.raw_cum
              --duration=1h
              --rate=5
              --metrics=100
---
apiVersion: apps/v1
kind: Deployment
metadata:
  name: telemetrygen-metrics-counter-delta
  namespace: observability
spec:
  replicas: 1
  selector:
    matchLabels:
      app: telemetrygen-metrics-counter-delta
  template:
    metadata:
      labels:
        app: telemetrygen-metrics-counter-delta
    spec:
      containers:
        - name: telemetrygen
          image: ghcr.io/open-telemetry/opentelemetry-collector-contrib/telemetrygen:0.151.0
          env:
            - name: NODE_IP
              valueFrom:
                fieldRef:
                  fieldPath: status.hostIP
          command: ["/bin/sh", "-c"]
          args:
            - >-
              exec /telemetrygen metrics
              --otlp-insecure
              --otlp-endpoint "${NODE_IP}:4317"
              --metric-type=Sum
              --aggregation-temporality=delta
              --otlp-metric-name=telemetrygen.counter.raw_delta
              --duration=1h
              --rate=5
              --metrics=100
---
apiVersion: apps/v1
kind: Deployment
metadata:
  name: telemetrygen-metrics-histogram
  namespace: observability
spec:
  replicas: 1
  selector:
    matchLabels:
      app: telemetrygen-metrics-histogram
  template:
    metadata:
      labels:
        app: telemetrygen-metrics-histogram
    spec:
      containers:
        - name: telemetrygen
          image: ghcr.io/open-telemetry/opentelemetry-collector-contrib/telemetrygen:0.151.0
          env:
            - name: NODE_IP
              valueFrom:
                fieldRef:
                  fieldPath: status.hostIP
          command: ["/bin/sh", "-c"]
          args:
            - >-
              exec /telemetrygen metrics
              --otlp-insecure
              --otlp-endpoint "${NODE_IP}:4317"
              --metric-type=Histogram
              --aggregation-temporality=cumulative
              --otlp-metric-name=telemetrygen.histogram.raw_cum
              --duration=1h
              --rate=5
              --metrics=100
---
apiVersion: apps/v1
kind: Deployment
metadata:
  name: telemetrygen-logs
  namespace: observability
spec:
  replicas: 1
  selector:
    matchLabels:
      app: telemetrygen-logs
  template:
    metadata:
      labels:
        app: telemetrygen-logs
    spec:
      containers:
        - name: telemetrygen
          image: ghcr.io/open-telemetry/opentelemetry-collector-contrib/telemetrygen:0.151.0
          env:
            - name: NODE_IP
              valueFrom:
                fieldRef:
                  fieldPath: status.hostIP
          command: ["/bin/sh", "-c"]
          args:
            - >-
              exec /telemetrygen logs
              --otlp-insecure
              --otlp-endpoint "${NODE_IP}:4317"
              --duration=1h
              --rate=5
              --logs=5
kubectl apply -f telemetrygen-load.yaml
kubectl -n observability rollout status deploy/telemetrygen-traces
kubectl -n observability logs deploy/telemetrygen-traces --tail=20When you are done, delete the generators so they do not keep exporting after --duration expires or the pod restarts:
kubectl delete -f telemetrygen-load.yaml
# or, for the smoke Jobs:
kubectl delete -f telemetrygen-smoke.yaml
Test a real instrumented service
After synthetic traffic looks correct, test a real in-cluster service that emits OTLP. The app’s business logic is secondary. The image must emit real telemetry. Use the same NODE_IP pattern in the workload spec:
env:
  - name: NODE_IP
    valueFrom:
      fieldRef:
        fieldPath: status.hostIP
  - name: OTEL_SERVICE_NAME
    value: sample-api
  - name: OTEL_EXPORTER_OTLP_PROTOCOL
    value: http/protobuf
  - name: OTEL_EXPORTER_OTLP_ENDPOINT
    value: "http://$(NODE_IP):4318"
For gRPC export instead, set OTEL_EXPORTER_OTLP_ENDPOINT to "http://$(NODE_IP):4317" and match the protocol your SDK expects.
Prove One Trace, One Metric, and One Log Arrived
Do not call the stack done when the pods are Running. Prove the path.
Start in Kubernetes:
kubectl get pods -n observability
kubectl logs -n observability -l app.kubernetes.io/instance=otel-node --tail=50
kubectl logs -n observability -l app.kubernetes.io/instance=otel-cluster --tail=50
Then check the backend:
| Signal | What to look for |
|---|---|
| Trace | Spans from telemetrygen Jobs or Deployments, then service.name=sample-api after curl /hello |
| Metric | telemetrygen.* metric names from load Deployments, plus node/pod metrics from Collector presets |
| Log | Log records from telemetrygen-logs, then sample API logs or Kubernetes events from the cluster path |
If you only see debug logs in the Collector pod and nothing in the backend, the stack is still a demo. Recheck the exporter block and the service pipelines. The chart presets can add receivers and processors. Routing still ends at the exporters you configure.
This is the difference between a toy local demo and a baseline monitoring pipeline.
There is one more practical check: verify metadata. A trace without Kubernetes context is hard to use when the problem is a crash loop, noisy node, or bad rollout. Look for attributes such as namespace, pod name, and node name on the telemetry your backend receives. The Kubernetes attributes preset exists because raw application telemetry is not enough in a cluster. You need workload identity attached while the Collector still has access to Kubernetes metadata. Same-node delivery makes that correlation more reliable because the enriching agent and the emitting pod share a node.
Use this failure checklist when the proof fails:
| Symptom | Likely cause |
|---|---|
| Collector pods run but the backend is empty | Exporter is missing from the pipeline, endpoint is wrong, or auth environment variable is missing |
| Traces arrive without pod metadata | Kubernetes attributes processor is missing or not active in the pipeline |
| Cluster metrics are duplicated | Cluster receiver is running in multiple replicas or in the DaemonSet path |
| App cannot export OTLP | Service name, port, or protocol does not match the receiver endpoint |
| OTLP reaches a Collector on another node | Collector hostPort is missing, client uses Service DNS without internalTrafficPolicy: Local, or client uses localhost |
| Logs are noisy or recursive | debug exporter and logs collection are misconfigured or exclusions are incomplete |
The Pitfalls to Avoid
The first pitfall is trying to do all Kubernetes monitoring with one Deployment Collector. That shape misses or complicates node-local collection. Logs live on nodes. Kubelet metrics are node-local. A DaemonSet is the natural fit.
The second pitfall is assuming Helm exports somewhere automatically. The chart gives you useful defaults and presets. Default debug export only writes telemetry for local inspection (OpenTelemetry Collector Chart).
The third pitfall is treating the OpenTelemetry Demo as a production pattern. The Kubernetes getting-started page is explicit: the Demo is a good way to see OTel in action. It is not intended as an example of how to monitor Kubernetes itself (OpenTelemetry Kubernetes Getting Started, OpenTelemetry Demo Docs).
The fourth pitfall is forgetting metadata. Without Kubernetes attributes, traces, metrics, and logs are much harder to correlate back to pods, namespaces, and nodes. The Helm chart has a Kubernetes attributes preset, and the getting-started flow puts metadata enrichment in the DaemonSet path for a reason.
The fifth pitfall is pointing application OTLP at a DaemonSet Service name without same-node routing, or at localhost from another pod. Prefer status.hostIP plus Collector hostPort, or Service DNS with internalTrafficPolicy: Local. A plain ClusterIP without one of those patterns can load-balance OTLP to another node.
What to Build Next
This baseline is the smallest shape that teaches the right instincts.
From here, harden it:
- replace placeholder backend auth with your secret management pattern
- set resource requests and limits for both Collector releases
- review RBAC generated by presets
- add sampling and filtering policy
- decide which telemetry routes through a central gateway
- create dashboards that prove coverage and routing health
You can also decide whether the node-local Collector should export directly to the backend or forward to a gateway Collector first. Direct export is simpler. A gateway gives you a central place for heavier processing and routing. Introduce that second tier when you have a reason. Keep it separate from the cluster-wide Deployment Collector used for Kubernetes metrics and events. They solve different problems.
Start with the baseline. A Kubernetes OTel stack works when responsibility is clear: node-local telemetry through a DaemonSet, cluster-wide telemetry through a Deployment, metadata attached early, and exporters configured from day one.
That foundation supports the rest of the stack.
Bonus: Monitor the Collector Itself
The baseline proves application and Kubernetes telemetry can reach a backend. However, collectors can sit in a bad state: pods could be Running, readiness passes, but the export queue can grow or processing not working properly.
The Collector exposes internal metrics about receivers, processors, exporters, queues, and process health. The Helm chart wires a self-scrape loop by default: internal telemetry is published on port 8888, and the chart’s prometheus receiver scrapes ${env:MY_POD_IP}:8888 on a short interval. Your job is to keep that receiver in the durable metrics pipeline and export the result through the same otlp_http/backend exporter you already configured.
Node-local Collector
The node values-node.yaml in this article already lists prometheus in the metrics pipeline:
      metrics:
        receivers: [otlp, prometheus, kubeletstats]
        processors: [k8sattributes, memory_limiter, batch]
        exporters: [otlp_http/backend]
That is the important part. When you customize pipelines, do not drop prometheus from the metrics receivers list. If you replace the entire config.service block instead of overlaying pipelines, copy the chart’s service.telemetry section as well. Without it, the Collector has nothing useful to scrape on :8888.
To make export problems easier to debug, raise internal metric verbosity. Merge this under config.service (it layers on top of the chart default):
  service:
    telemetry:
      metrics:
        level: detailed
      resource:
        collector.role: node
detailed adds per-pipeline dimensions on top of the default normal level. The extra collector.role attribute helps you tell node and cluster Collector series apart in the backend.
Re-render and confirm the scrape target and pipeline membership survived:
helm template otel-node open-telemetry/opentelemetry-collector \
  --namespace observability \
  --version "$OTEL_COLLECTOR_CHART_VERSION" \
  --values values-node.yaml > rendered-node.yaml

grep -n "8888\|opentelemetry-collector\|prometheus:" -A6 rendered-node.yaml
grep -n "receivers: \[otlp, prometheus" rendered-node.yaml
From a running pod, the metrics endpoint should answer on the pod IP the chart configures:
POD=$(kubectl -n observability get pod -l app.kubernetes.io/instance=otel-node -o jsonpath='{.items[0].metadata.name}')
POD_IP=$(kubectl -n observability get pod "$POD" -o jsonpath='{.status.podIP}')
kubectl -n observability exec "$POD" -- wget -qO- "http://${POD_IP}:8888/metrics" | grep '^otelcol_exporter' | head
You should see otelcol_exporter_* counters and gauges before you look in the backend.
Cluster-wide Collector
The cluster values-cluster.yaml only exports cluster metrics today:
      metrics:
        receivers: [k8s_cluster]
Add the same self-scrape receiver there. The chart still provides the prometheus receiver definition; you only need to attach it to the metrics pipeline:
  service:
    telemetry:
      metrics:
        level: detailed
      resource:
        collector.role: cluster
    pipelines:
      metrics:
        receivers: [prometheus, k8s_cluster]
        processors: [memory_limiter, batch]
        exporters: [otlp_http/backend]
Upgrade the release (or re-install) and repeat the render checks against rendered-cluster.yaml.
Prove Collector Metrics Reached the Backend
After you upgrade both releases, wait one or two scrape intervals (the chart default is 10s) and search the backend for Collector-internal series. Exact label names vary by backend, but the signal names are stable.
| Metric (OTLP name) | What it tells you |
|---|---|
otelcol_exporter_sent_spans / otelcol_exporter_sent_metric_points / otelcol_exporter_sent_log_records | Export path is moving data |
otelcol_exporter_send_failed_spans / otelcol_exporter_send_failed_metric_points / otelcol_exporter_send_failed_log_records | Backend rejections, network errors, or misconfigured endpoints |
otelcol_exporter_enqueue_failed_* | Collector is accepting data but cannot queue it for export (often memory pressure or a full queue) |
otelcol_exporter_queue_size / otelcol_exporter_queue_capacity | Backpressure building before exports fail outright |
otelcol_receiver_refused_spans / otelcol_receiver_refused_metric_points / otelcol_receiver_refused_log_records | Receivers rejecting data (limits, malformed payloads, downstream processor errors) |
otelcol_process_memory_rss / otelcol_process_cpu_seconds | Collector resource pressure on the node or in the Deployment |
Filter by Kubernetes metadata the chart already attaches (k8s.pod.name, k8s.namespace.name, host.name) or by collector.role if you added it. You want one time series per Collector pod, not a single aggregate that hides a failing DaemonSet pod on one noisy node.
Alternative: Push Internal Metrics Directly
The chart also supports internalTelemetryViaOTLP, which configures the Collector SDK to push internal metrics (and optionally logs or traces) to an OTLP endpoint instead of using the Prometheus scrape loop. That option is marked experimental in the chart and removes the default prometheus self-scrape receiver when metrics are enabled. For this baseline, the scrape-and-forward path is simpler because it reuses the same metrics pipeline and backend exporter you already proved. Consider direct OTLP export later if you want internal telemetry isolated from application metric cardinality or routed to a dedicated monitoring tenant.
Sources
Written by Nicolas Narbais
I write about observability, OpenTelemetry, Tsuga, Datadog, and the practical work of making monitoring useful for engineering teams. I am also building Digitam to help teams reduce telemetry waste and improve observability outcomes.
Building an OpenTelemetry pipeline?
Explore more implementation guides and collector patterns for teams standardizing telemetry without adding unnecessary noise.